Study characteristics
Of the 582 articles identified through our electronic search, 33 were selected for full-text review. Finally, 14 articles published between 2010 and 2022 were analyzed in detail, as shown in Fig. 1 and summarized in Table 1. These 14 studies were conducted in multiple countries, namely seven in the United States, three in Taiwan, two in Singapore, one in the United Kingdom, and one in Portugal.
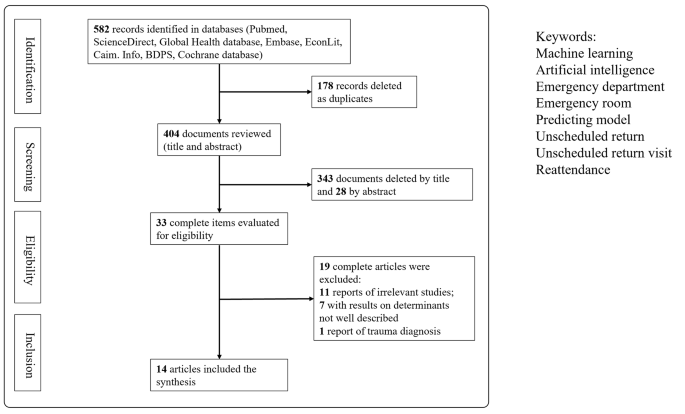
PRISMA flow diagram of the study selection process
The selected studies analyzed the interval between each patient’s first visit and return visit; these intervals were then divided into groups of 72 h, 9 days, and 1 month. Nine articles exclusively predicted 72-hour return visits; Hong et al. predicted two outcomes, namely return visits within 72 h and return visits within 9 days [17]; and four articles predicted return visits within 30 days.
Data sample and predictors
In all the 14 selected articles, the study population comprised patients visiting EDs, with sample sizes approximately ranging from 200 to 1.25 million individuals. The study conducted by Suffoletto et al. [12] had the fewest participants; that study focused on patients older than 65 years, was conducted in two hospitals with 404 and 520 beds, and analyzed only 202 participants. By contrast, Poole et al. used the dataset of the Indiana Public Health Emergency Surveillance System, which covers more than 1.25 million patients and contains medical data from multiple institutions [11]. Although the data used for ML model implementation were specific to each study, several common categories were identified. These categories included demographic variables (e.g., age, sex), clinical variables (e.g., vital signs, diagnoses based on International Classification of Diseases codes), arrival information (e.g., arrival time, triage level, transport mode), and types of examinations (e.g., blood tests, images). Ten of the 14 analyzed articles included information regarding comorbidities or medical history [3, 9, 11, 12, 15, 17,18,19,20,21]. In addition, six of the articles considered chief or triage complaints, with those without chief complaints as variables using diagnoses instead [12,13,14, 16, 20, 21]. Four studies presented information regarding the use of hospital metrics (e.g., number of prior ED visits, number of prior hospitalizations) [3, 14, 19, 20]. Finally, in addition to using clinical variables, five articles linked their data to paramedical information, such as ethnicity, socioeconomic status, educational level, and insurance status [3, 10, 11, 20, 21].
ML process
Candidate variable handling and feature engineering
In most of the selected studies, all the variables were included in the implemented models. Both Fernandes et al. [16] and Poole et al. [11] used stepwise methods for feature selection to reduce the number of input variables.
Data resampling
In most of the selected articles, the datasets were randomly divided into training and testing datasets. Cross-validation, which can help prevent the overfitting or underfitting of a model, was used in five of the selected studies [3, 9, 15, 17, 19].
Prediction algorithms and calibration of parameters
In total, 33 models were used to predict ED return visits. Logistic regression (LR; n = 9/14 articles) and eXtreme Gradient Boosting (XGB; n = 5/14) were the two most widely used methods, followed by random forest (RF; n = 3/14) and then discriminant analysis using mixed integer programming (DAMIP; n = 2/14) and decision tree–based models (n = 2/14) (Fig. 2). Some models were used in only one study. Only nine models in five studies used the cross-validation method to validate the model performance or to tune hyperparameters. R and Python were the most commonly used tools.

Frequency of commonly used ML models in the included studies
Evaluation metrics
The metrics used to evaluate the performances of the tested models included the area under the receiver operating characteristic (ROC) curve (AUC), sensitivity and specificity, and accuracy. The ROC-AUC metrics were the most frequently used.
Model agnostic methods
The majority of the authors used LR coefficients to determine significant variables. Feature importance analysis was implemented in seven studies to calculate the importance of the predictors [10, 11, 13, 17, 19,20,21].
Model performance assessment
Interval between two visits (72 h, 9 days, 30 days)
Most of the studies (n = 11/14) focused on predicting URVs within a 72-hour interval. A total of 25 models were developed to predict 72-hour URVs, whereas two models were developed for 9-day URVs and six were developed for 30-day URVs. The AUC was used to evaluate the performances of the predictive models; the corresponding results are presented in Table 1. For 72-hour URVs, LR was the most commonly adopted method, with a median AUC of 0.72 and an interquartile range (IQR) of 0.69–0.77. XGB exhibited similar predictive power across all the studies where it was used, with a median AUC of 0.73 and an IQR of 0.71–0.76. For 30-day URVs, the AUC ranged from 0.69 to 0.98, with LR achieving the lowest score of 0.69 in the study with 202 patients [12]. The RF model achieved the highest score, namely 0.98 in the study with approximately 1.25 million patients [11]. The highest AUCs of all the studies are presented in Fig. 3.

Highest AUCs in all the analyzed studies
Patient population
Different target groups were present in the 14 analyzed studies. Six articles analyzed all patients who visited the included EDs, whereas others focused on specific age groups, including adult patients (n = 3/14), pediatric patients (n = 2/14) and older adult patients (n = 2/14). Hsu et al. conducted the only study that focused on adult patients with abdominal pain [20]. For 72-hour URV prediction across the various patient populations, the AUCs ranged from 0.7 to 0.85, and no significant differences between target groups were observed (Fig. 4).

Highest AUCs for 72-hour URVs determined by the predictive models for multiple patient groups
Research scale
The selected articles were divided into single-center, multicenter, and national database studies on the basis of their research scale. Five of the articles used data from a single hospital, and four articles analyzed data from multiple hospitals. In addition, five articles employed national or statewide databases from the United States, Taiwan, Singapore, or the American state of Indiana. For 72-hour URVs, no evident differences in AUCs were observed among studies with different research scales (Fig. 5).

Highest AUCs for 72-hour URVs determined by the predictive models for multiple research scales


")