This section presents the outcomes of attribute-ranking methods and their comparison to classifiers optimized through hyperparameter optimization techniques. Bayesian and random optimizations, along with cross-validation, are applied to SVM, Ensemble, and Neural Networks to enhance performance and mitigate overfitting.
Initially, four attribute-ranking techniques are employed for the Ft dataset. Table 2 outlines rankings for various attribute-ranking models: ReliefF (RLF), SVM, Chi-Sq, and GI. The “Attribute Index” column assigns a unique value to each soil feature, with pH indexed as 1, sand (Sd) as 2, silt (Si) as 3, and so forth. The first row in columns rk(ReliefF), rk(SVM), rk(Chi-Square), and rk(Gini-Index) designates the top-ranked attribute, which is 4 (Cy). The second row lists the subsequent best-ranked features, namely 8 (N), 18 (Pb), 3 (Si), and 8 (N), respectively. Similarly, the final row displays the least of the best-ranked features: 21 (K), 15 (Fe), 12 (Cu), 21 (K). Furthermore, when we examine the top 10 attributes from all the attribute-ranking models in Table 2, we can draw the following conclusions:
-
1.
Five attributes-Zinc (Zn), Clay (Cy), Soluble Salts (SS), Nitrogen (N), and Silt (Si)-appear consistently across all feature-ranking models.
-
2.
Six attributes-Zinc (Zn), Clay (Cy), Soluble Salts (SS), Nitrogen (N), Silt (Si), and Lead (Pb)-are present in the rankings of SVM, Chi-Square (Chi-Sq), and Gini-Index (GI).
-
3.
Seven attributes-Nickel (Ni), Zinc (Zn), Clay (Cy), Soluble Salts (SS), Nitrogen (N), Silt (Si), and Moisture (Ms)-are shared between ReliefF (RLF) and SVM.
-
4.
Another set of seven attributes-Magnesium (Mg), Zinc (Zn), Clay (Cy), Soluble Salts (SS), Nitrogen (N), Silt (Si), and Organic Matter (OM)-are common among ReliefF (RLF), Chi-Square (Chi-Sq), and Gini-Index (GI).
-
5.
Finally, nine attributes-Magnesium (Mg), Manganese (Mn), Zinc (Zn), Clay (Cy), Soluble Salts (SS), Nitrogen (N), Silt (Si), Lead (Pb), and Organic Matter (OM)-are shared between Chi-Square (Chi-Sq) and Gini-Index (GI).
Similarly, as shown in Table 2, when examining the 11 attributes contributing the least, five of them -Potassium (K), Calcium (Ca), Chromium (Cr), Copper (Cu), and pH- persist across all feature-ranking models.
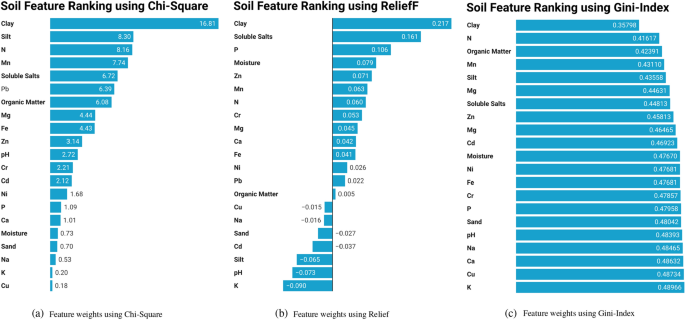
The Fig 2 illustrates the outcomes of three distinct feature ranking algorithms: Chi-Square, ReliefF, and Gini-Index. In the Chi-Square algorithm, Clay emerges as the most influential feature with a substantial weight of 16.81. Silt and Nitrogen follow closely with weights of 8.30 and 8.16, emphasizing their significant contributions to the classification. Conversely, Copper and Potassium are identified as the least significant features, each receiving minimal weights of 0.18 and 0.20. The ReliefF algorithm corroborates the significance of Clay, ranking it as the most important soil feature with a weight of 0.217. Following Clay, Soluble Salts and Phosphorus exhibit weights of 0.161 and 0.106, respectively. Notably, Potassium and pH emerge as the least significant features with weights of \(-0.090\) and \(-0.073\). Similarly, the Gini-Index algorithm underscores Clay as the most crucial feature, assigned a weight of 0.35798. Nitrogen and Organic Matter follow closely with weights of 0.41617 and 0.42391, respectively. On the other hand, Potassium and Copper are identified as the least significant features, each with weights of 0.48966 and 0.48734. These weights offer a quantitative measure of each feature’s impact, facilitating the identification of key contributors and less influential variables in the context of pathogen prevalence in soil.
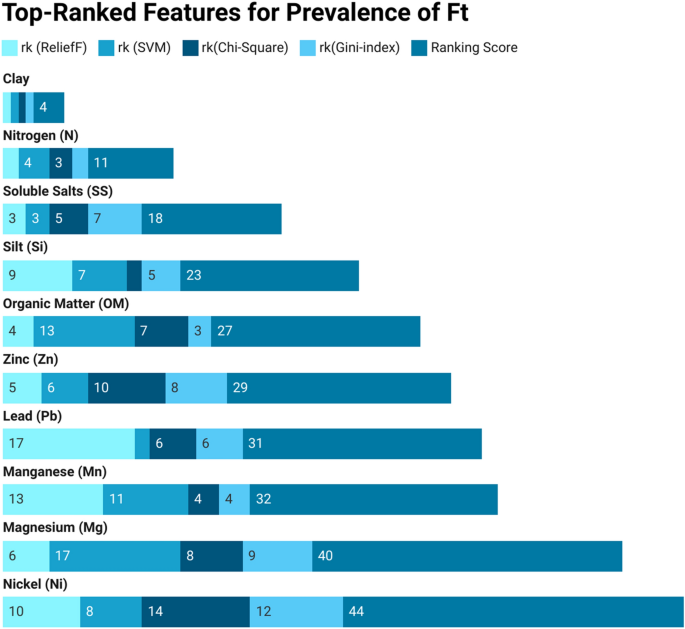
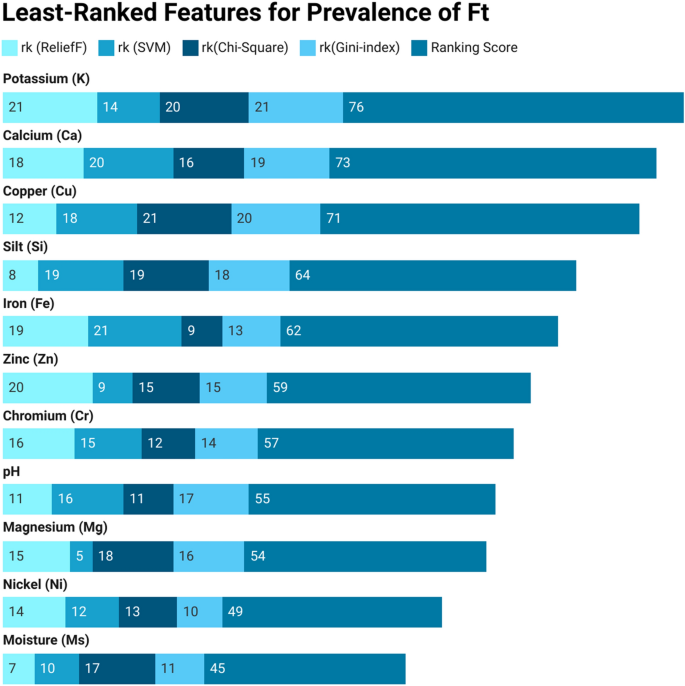
Next, we perform a two-stage attribute ranking to assess each feature’s impact on the prevalence of Ft in soil-related environments. Initially, various feature-ranking approaches are employed to rank soil features, followed by the calculation of weighted scores to determine the final rank using a combination of techniques. Tables 3 and 4 showcase the top-ranked and least-ranked soil features, respectively. These tables present the scores assigned by each attribute-ranking model and the cumulative score for each feature in the Ft soil feature dataset. The final score represents the sum of scores from all feature-ranking models. A lower score indicates a higher rank, while a higher score implies a lower rank for the soil attribute.
The 1st row of the Table 3 shows that Clay (Cy) holds the 1st rank in RLF, SVM, Chi-Sq, and GI, with a cumulative score of 4 (1+1+1+1=4). The 2nd row shows Nitrogen (N) with ranks 2, 4, 3, and 2 by RLF, SVM, Chi-Sq, and GI, respectively, resulting in a cumulative score of 11. Similarly, the last row indicates Nickel (Ni) ranked 10, 8, 14, and 12 by RLF, SVM, Chi-Sq, and GI, respectively, with a cumulative score of 44. Clay (Cy) emerges as the top-ranked feature with a cumulative score of 4, while Nitrogen (N) secures the 2nd position with a cumulative score of 11. Similarly, the last row indicates that Nickel (Ni) holds the 10th rank, accumulating a cumulative score of 44. Likewise, examining the details in Table 4 reveals that Potassium (K) holds the lowest rank, having a cumulative score of 76. This score is obtained by summing the scores from all feature-ranking models (\(21+14+20+21=76\)). Following closely behind are Calcium (Ca), Copper (Cu), and Sodium (Na), with cumulative scores of 73 (\(18+20+16+19\)), 71 (\(12+18+21+20\)), and 64 (\(8+19+19+18\)), respectively, and so forth.
The bar charts in Figs. 3 and 4 offer a clear overview of attribute rankings, presenting the cumulative score for each feature in distinct colors. Different shades of blue represent the ranking scores (rk) for ReliefF (RLF), Support Vector Machine (SVM), Chi-Square (Chi-Sq), and Gini-Index (GI), while the dark blue “Ranking Score” indicates the cumulative score across all feature-ranking methods. The best-ranked attribute, Clay (Cy), secures the top position with a cumulative score of 4. Various shades of light blue represent the ranking scores from different methods, all of which are 1 for each algorithm. The final cumulative score, depicted in dark blue, is achieved by combining the rankings across all feature-ranking methods (\(1+1+1+1=4\)), and so on. Similarly, for the least-ranked attribute, Potassium (K), claims the lowest position with a cumulative score of 76. Distinct light blue shades represent scores from different methods-21 for RLF, 14 for SVM, 20 for Chi-Sq, and 21 for GI. The final cumulative score, represented in dark blue, is obtained by summing the rankings across all feature-ranking methods (21+14+20+21=76), and so on.
Next, we evaluated the performance of various attribute-ranking models against different classifiers, optimizing them using Bayesian and random search techniques for improved results. The experimental outcomes are presented in Table 5. For ReliefF (RLF), the “rank” row indicates the sequence of ranked features. The table then showcases the results of Bayesian and random search optimization for various machine learning classifiers (SVM, EM, and NN) based on the RLF ranking. Classification accuracy ranges from 86.5 (SVM) to 73.6% (NN) with different ranking models, classifiers, and optimization techniques.
The attribute with the most impact for RLF is Cy. Using this attribute, SVM, EM, and NN achieve accuracies of 77%, 75%, and 75%, respectively, and 73.6%, 77%, and 73% for Bayesian optimization (BO) and Random Search optimization (RS). The results in Table 5 reveal several key findings:
-
1.
The two optimization techniques yield different results for various classification models.
-
2.
For both optimization techniques, SVM achieves an accuracy of 86.5% for 15 soil features.
-
3.
The performance of different classification models is inherently arbitrary:
-
(a)
(BO+SVM, 86.5%)
-
(b)
(RS+SVM, 86.5%)
-
(c)
(BO+EM, 81.8%)
-
(d)
(RS+EM, 81.1%)
-
(e)
(BO+NN, 83.8%)
-
(f)
(RS+NN, 83.1%).
-
(a)
-
4.
The results suggest that the BO optimization technique yields more favorable outcomes for classifiers like SVM, EM, and NN compared to RS.
-
5.
SVM outperforms other classifiers for both BO and RS.
-
6.
BO+SVM produces the best classification results for the 15 soil features: Cy, N, SS, Si, OM, Zn, Pb, Mn, Mg, Ni, Ms, Cd, Si, pH, Cr.
-
7.
Other models, such as BO+NN and RS+NN, also generate noteworthy results of 83.8% and 83.1%, utilizing 16 and 15 soil features, respectively.
Finally, we present our proposed SVM classifier, which was optimized using bayesian optimization technique to generate F-1 Score of 86.5% and accuracy of 86.5%. The details of training results, models details, optimized hyperparameters, and optimizer options are shown in the Table 6.
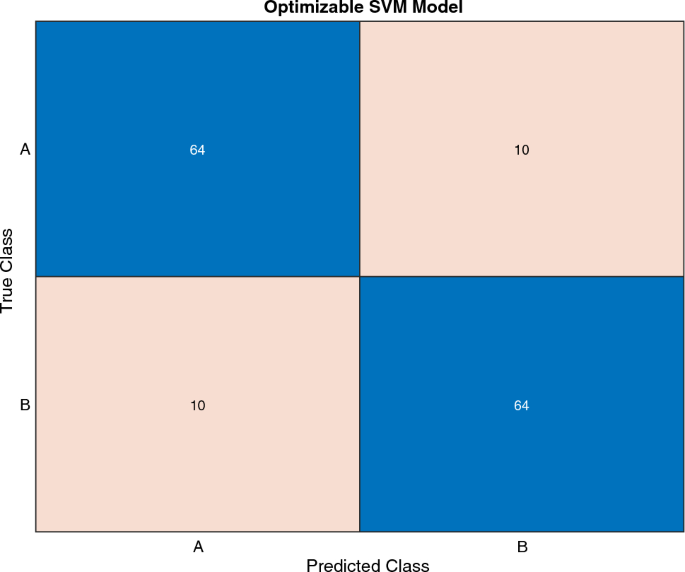
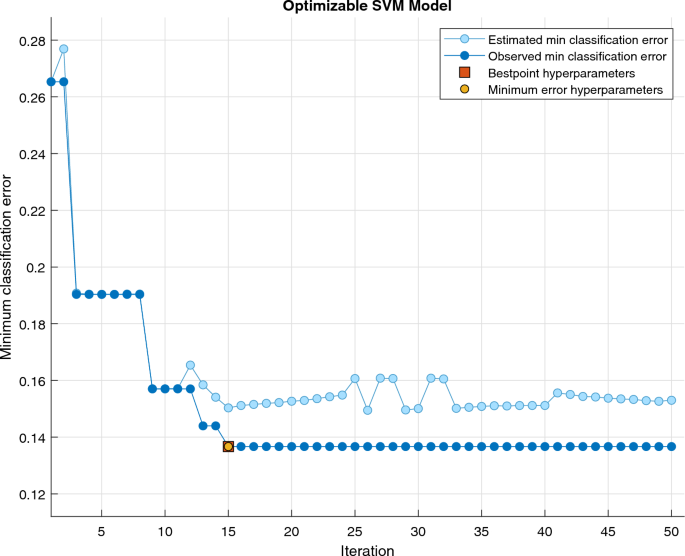
The Fig. 5 depicts the confusion matrix, assessing the performance of the optimized SVM classifier in distinguishing between Class A (Positive) and Class B (Negative). The matrix involves a total of 148 instances, evenly distributed between the positive and negative classes, each comprising 74 instances. Among the 74 positive instances, 64 are correctly classified (True Positives—TP) as Class A, while 10 instances are misclassified (False Negatives—FN) as Class B. Similarly, out of the 74 negative samples, 64 instances are correctly classified (True Negatives—TN) as Class B, with 10 instances being misclassified (False Positives—FP) as Class A. A good classifier has a dominantly diagonal confusion matrix since most of the predictor variables matched the actual labels with only a few off-diagonal numbers that indicate confusion between classes, as is visible in the case of our presented optimized SVM model. The Fig. 6 error plot for the SVM model provides a visual representation of the classification error analysis. In the plot, the estimated minimum classification error is depicted by light blue circler points, while the observed minimum classification error is represented in dark blue points. The orange box highlights the hyperparameters associated with the best-performing point, indicating the configuration that yielded optimal results during the training process. Additionally, the yellow circle signifies the hyperparameters corresponding to the minimum observed error, pinpointing the configuration where the SVM model achieved its highest accuracy. his graphical representation aids in identifying the effectiveness of different hyperparameter settings, allowing for a nuanced understanding of the model’s performance and guiding the selection of optimal configurations for future experiments.
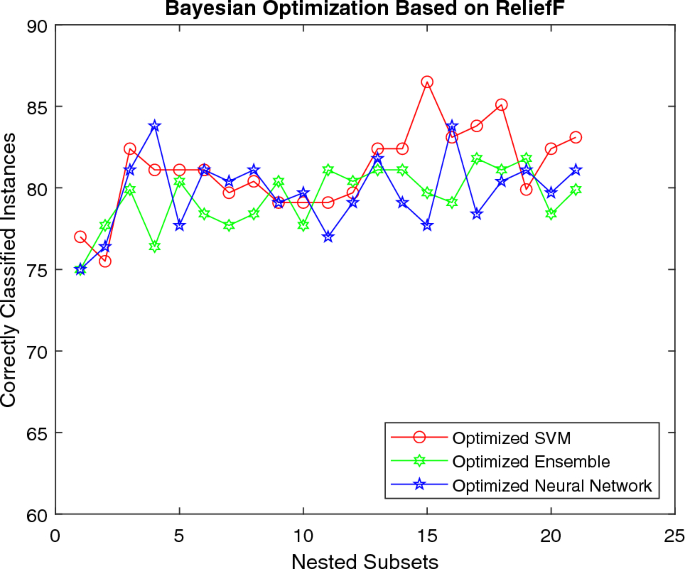
The Figs. 7 and 8 exhibit the change in the classification performance of algorithms as the number of attributes is altered while using different hyperparameter optimization techniques. Figure 7 displays the performance of classifiers using RLF and BO strategies. For the same feature set, NN generates more promising results than other classification models for the initial set of features. However, these models show similar results for mid-level features. SVM surpasses other models for the last few attributes. The outcomes illustrate that overall SVM yields the best results by generating an accuracy of 86.5%. So, the overall performance of SVM is far better than other machine learning classifiers
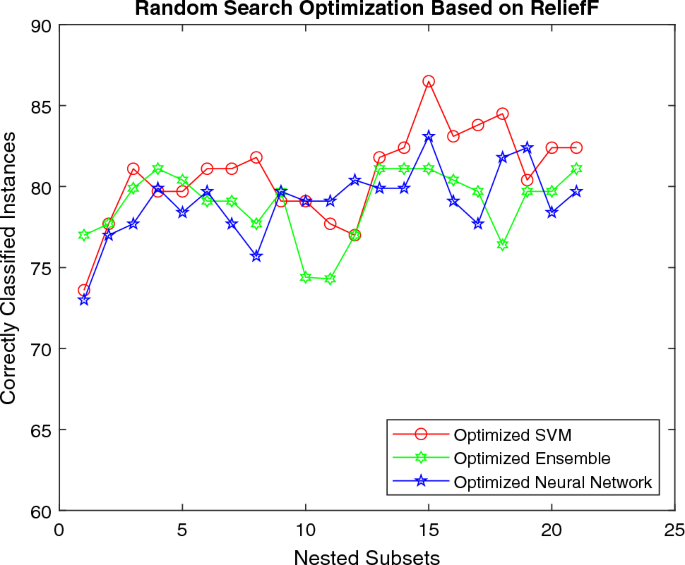
The Fig. 8 shows the accuracy of machine learning models for RLF using RS technique. For the initial set of features all the machine classifiers seem to generate similar resutls better results. However, SVM surpasses all the classification models for mid and final-level features by generating a classification accuracy of 86.5%.
In summary, the results propose that:
-
1.
While assessing the top 10 features, the 5 most contributing features common among all are {Cy, N, SS, Si, Zn}.
-
2.
The 5 least significant features for Ft are { K, Ca, Cr, Cu, pH}.
-
3.
Hyperparameter optimization using BO produces better outcomes than other optimization techniques.
-
4.
SVM is the best performer among classification models.
-
5.
SVM achieves the best classification accuracy of 86.5% for the first 15 soil features {Cy, N, SS, Si, OM, Zn, Pb, Mn, Mg, Ni, Ms, Cd, Si, pH, Cr} using BO and RS.
-
6.
For multi-dimensional data, optimizing the parameters of machine learning models can significantly improve performance by using hyperparameter optimization techniques. Therefore, the selection of correct hyperparameters is essential for yielding good classification results.
Comparative analysis with prior machine learning techniques
Few recent works applied machine learning for classifying various soil-borne pathogenic bacteria like F. tularensis and C. burnetiia; and the conditions that support their sustenance in soil, as exhibited in Table 7. But, our presented design uses hyperparameter tuning with two-stage attribute-ranking on a new F. tularensis dataset, contrary to previous research.
Discussions
Machine learning models are applied as a benchmark in various fields, like, disease diagnosis38,60,61,41 bio-informatics42, medical science43, agriculture44, and soil classification45. Our work reveals that these models, rather than current statistical techniques demonstrate outstanding results for the classification of F. tularensis and learning its behavior in soil settings.
The results highlight the significance of specific soil characteristics for the survival of F. tularensis, as illustrated in Table 3. Previous analyses have consistently pointed to abiotic factors, such as organic matter, clay, and various micro-nutrients, as primary drivers of bacterial communities in soil46,43,44,49. Moreover, these factors positively correlate with the prevalence of soil-borne pathogenic bacteria50,47,52. Clay and silt, known for their increased surface area, are suggested to contain a significant amount of organic matter, potentially fostering the existence of bacteria53. Recent studies16,17,37,54 also emphasize the importance of soil’s physical and chemical properties, including clay, nitrogen, soluble salts, silt, organic matter, zinc, lead, and nickel, for the persistence of F. tularensis, C. burnetii, and B. anthracis.
Our investigation underscores clay as the most influential attribute for the presence of F. tularensis in soil, aligning with previous works16,32,52. Subsequent crucial attributes contributing to the sustenance of the bacterial pathogen include nitrogen, soluble salts, silt, organic matter, and zinc. Organic matter is established as beneficial for bacterial survival in soil settings16,51,52, while nitrogen is crucial for the persistence of pathogens within their hosts55. Zinc, soluble salts, organic matter, and nitrogen are identified as related to the survival of F. tularensis in the soil16,32,56. Zinc, in particular, plays a role in various cellular operations, including metabolism, gene expression, pH regulation, glycolysis, DNA replication, and amino acid synthesis57, with excess zinc potentially inducing toxicity58. Recent works32,54 suggest a positive association between soluble salts and the prevalence of F. tularensis and C. burnetii. Additionally, studies56,59 indicate that organic matter and nitrogen are associated with the prevalence of A. brasilense and C. burnetii.
The remaining contributing features from Table 3 include lead, manganese, magnesium, and nickel. Our results align with studies16,22,32 that establish positive correlations between attributes such as manganese, magnesium, lead, and nickel and F. tularensis in soil. Organic matter, manganese, and magnesium are associated with B. anthracis, and magnesium is linked to the prevalence of C. burnetii in soil17. Magnesium also contributes to bacterial survival during starvation and cold shocks60.
Our study also reveals that cadmium, moisture, sand, and pH play intermediary roles. Earlier works47,44,49 stress the importance of pH, soil texture, and soil nutrients for microbial communities. Recent analysis22 supports a positive association between F. tularensis and cadmium, pH, and moisture in soil environments. Another work61 suggests F. tularensis is associated with low temperature and moisture, emphasizing the pathogen’s affinity for these conditions. Univariate analysis54 shows significant differences among C. burnetii positive and negative soils for pH, nitrogen, magnesium, soluble salts, and organic matter.
Our results indicate that the least contributing soil attributes, as shown in Table 4, include potassium, calcium, copper, sodium, iron, phosphorus, and chromium. This aligns with recent findings22 displaying no substantial differences between F. tularensis negative and positive sites concerning copper, sand, iron, calcium, phosphorous, chromium, and sodium in the soil. Conversely, B. anthracis and C. burnetii exhibit positive affinities to copper, chromium, cobalt, cadmium, sodium, iron, calcium, and potassium17. Additionally, research19 suggests sodium and potassium facilitate F. tularensis growth in water and soil. Recent research54 shows no substantial differences among Coxiella positive and negative sites related to copper, chromium, iron, and phosphorus in the soil. Analysis16 and similar work32 indicate that soil features like copper, chromium, phosphorus, iron, sodium, potassium, and calcium do not exhibit any affiliation with F. tularensis. Nonetheless, other studies62 acknowledge that the aerobic heterotrophic community is sensitive to various nutrients, including zinc, cadmium, chromium, mercury, manganese, nickel, and copper.
Comparing our current findings with our previous publication on F. tularensis using machine learning, we observe a slight variation in the sequence of the most significant factors. In the current work, the order of significance is clay, nitrogen, soluble salts, silt, organic matter, and zinc. However, in our previous work, the sequence was clay, nitrogen, organic matter, soluble salts, zinc, and silt. Similarly, when examining the sequence of least significant factors in the current research, we find potassium, calcium, copper, sodium, iron, and phosphorus to have the least impact. In contrast, our earlier work identified potassium, phosphorus, iron, calcium, copper, chromium, and sand as the least influential. The observed shift in sequence can be attributed to the adoption of a more effective ranking methodology in which features are evaluated based on the accumulative weighted score of all methods. This refined approach allowed us to discern a more nuanced order of significance among the key factors influencing the survival of F. tularensis in soil. Furthermore, the implementation of hyperparameter optimization played a pivotal role in enhancing accuracy, leading to an improvement of over 2% compared to our previous work. The meticulous fine-tuning of hyperparameters contributed to a more robust and accurate machine learning model, thereby reinforcing the reliability of our current findings.
